
This article is the second in a series of publications focusing on the creation of a LakeHouse with Hudi from a streaming ingest processed by a Flink application. The first article focuses on laying a good foundation for this platform, where Flink applications were deployed with KDA (Kinesis Data Analytics) for each type of format (MoR, CoW for Hudi and JSON) that write the result of this processing into buckets.
The input data was sent in the previous article from a local machine running a Locust application, which can present problems when scaling and processing a high volume of events. In addition, Kinesis Data Analytics applications with Flink present agility problems in their auto-scaling mode. All these new challenges will be solved in this article.
These tables will also be cataloged in Glue, a service that provides a data catalog in AWS, in order to access them and perform queries of all kinds. The query engine that will consume this metadata will be Athena, which provides a scalable, agile and serverless experience to be able to execute queries with SQL or Spark for our tables hosted in S3.
On the other hand, in this article we have also deployed the necessary components to be able to monitor our applications and thus draw conclusions about the speed at which data is ingested and the possible problems to be solved so that the processing has the required latency according to the requirements imposed.
Finally, a performance and latency comparison of the different Flink applications that write data in Hudi and JSON formats will be made in order to see the different advantages and disadvantages of these formats.
Below you can see the high-level architecture that will be deployed:
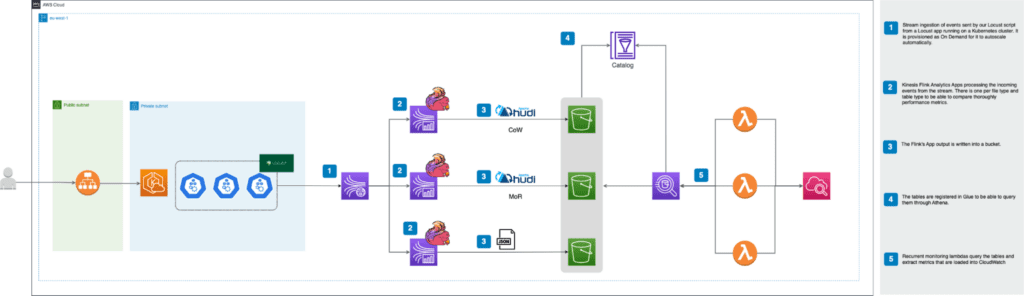
For a better understanding we are going to explain it from left to right. As you can see, the most notable change with respect to the first article is the inclusion of a Kubernetes cluster to be able to scale the events that will be sent as input to our streaming application. In this way, it will be possible to thoroughly test the performance of Flink applications depending on their provisioning and especially on the type of format and table in which they write to the LakeHouse. In addition, an ALB (Application Load Balancer) has been made available to access the Locust interface to define the number of users to simulate and how they should scale over time. The URL to access this will appear as output when deploying the infrastructure with Terraform.
On the other hand, significant changes have been made to the Flink KDA applications and the stream they read from. Each application now reads as EFO (Enhanced Fan Out) consumers, so that each of them has a dedicated bandwidth. The reason for this change and its details will be explained in more detail in the dedicated section for Kinesis.
Regarding the monitoring and extraction of metrics in NRT (Near Real Time), lambdas functions have been deployed that query the tables based on Athena thanks to having registered the metadata of these tables in the Glue catalog. It is important to note that the metadata of Hudi tables are registered in Glue by Flink but in the case of JSON a crawler is deployed that registers these tables in the catalog. This crawler must be executed manually for this table to be registered in Glue.
Since the goal is to subject the application to a considerable load of events per second, it is necessary to explain how each of the pieces of the architecture can scale according to the volume of data.
As previously mentioned, a Kinesis Stream On-Demand has been chosen to automate the scaling of the shards during load testing. It should be noted that these streams can accommodate a write rate of up to 200% of that specified by the number of shards at any given time.
Once the stream is above 100%, it will automatically increase the number of shards within 15 minutes. The only limitation is therefore not to exceed twice the supported write volume in less than that period.
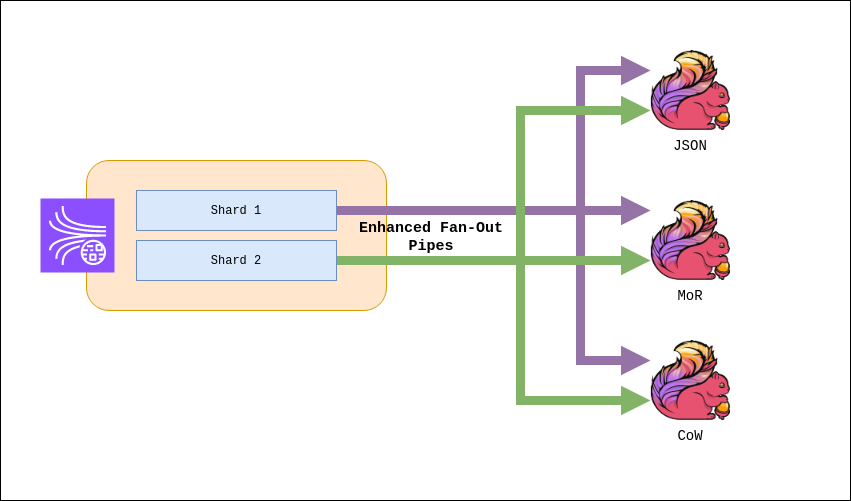
On the other hand, since you will have three Flink applications reading from the same stream, read limitations will be the biggest problem. A Kinesis Stream only supports 5 GetRecord calls per shard per second. Since each application has to read the entire stream (and therefore all shards), increasing the number of shards does not help to solve this problem.
The solution is to register each application as an Enhanced Fan-Out consumer. This functionality of the Kinesis Stream provides each of these consumers with an individual limit of 5 GetRecord calls and 2MB per shard per second of reading.
This configuration is done on the consumer side, in our case via the Kinesis connector for Flink:
'scan.stream.recordpublisher' = 'EFO',
'scan.stream.efo.registration' = 'EAGER/LAZY',
'scan.stream.efo.consumername' = '{consumer_name}'
It is worth mentioning that alternatively, it is possible to increase the read latency of our Flink applications. By default Flink performs a read every 200ms per shard, so one application completely consumes the read quota of a stream. By increasing this value to 600ms we could accommodate all three applications, at the cost of increased latency:
scan.shard.getrecords.intervalmillis = '600' Use will also be made of the Adaptive Reads option, which dynamically modifies the number of events collected per call depending on the size of each record. This makes it possible to take advantage of the 2 MB/s per shard available for each consumer:
'scan.shard.adaptivereads' = 'true' Regarding scaling in Flink KPUs (Kinesis Processing Unit), we have chosen not to make use of autoscaling, since each scaling process incurs in downtime for the application. Due to the different requirements of each of the applications, scaling actions at unexpected times could interrupt load testing. In addition, it is interesting to measure the write performance of each of the applications at equal computing capacity.
One of the basic systems on which Hudi’s operation and features are based is the timeline. Hudi keeps a temporary record of all the actions that have been performed on the table, as well as the status of this action.
The main actions that make up the timeline are as follows
Any of these actions can be found in one of three states
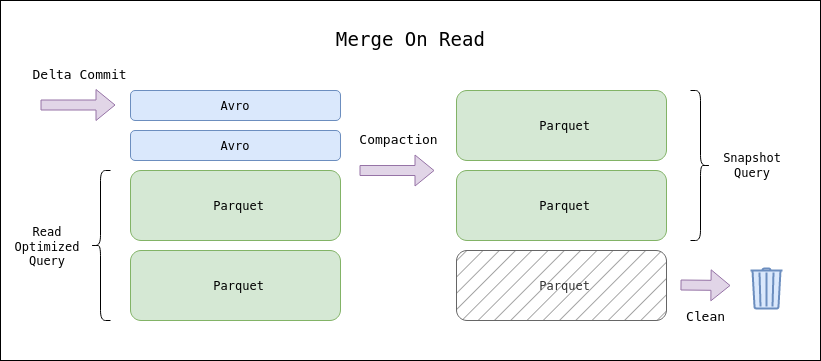
As hinted in the operation of the Hudi timeline, there are two types of writing supported: columnar and logs. The columnar (parquet) format constitutes the final form of a Hudi table, together with the timeline metadata. However, it is possible to make use of log writes (avro) to decrease the write latency and eventually compact to columnar format without hindering the write.
The use of these writing methods gives rise to the two types of table that Hudi makes available to us
In order to take advantage of the characteristics of each type of table, there are three types of queries that can be performed on a Hudi table
The Hudi connector allows a native integration with the Glue catalog in AWS. Simply add the Hive dependencies in our Flink application:
com.amazonaws.aws-java-sdk-glue
org.apache.hive.hive-common
org.apache.hive.hive-exec
And specify the catalog configuration in the Hudi connector:
'hive_sync.enable' = 'true',
'hive_sync.db' = '{glue_database}',
'hive_sync.table' = '{table_name}',
'hive_sync.partition_fields' = '{partition_fields}',
'hive_sync.mode' = 'glue',
'hive_sync.use_jdbc' = 'false'
With this integration, the application will automatically create the tables in the catalog. As mentioned before, there are different types of queries to query a Hudi table. Therefore, different tables will be created in the catalog to support the different queries.
For a CoW table, the table will be queried using a Snapshot query. For MoR on the other hand, two tables will be made available to support Read Optimized or Snapshot queries.
The main application of Glue is to support lambdas so that when executing queries through Athena their execution can be done in a more efficient, fast and secure way:
It is important to understand the configurations offered by Hudi to optimize our application, in particular for a Near Real Time application it is convenient to be aware of the available options. Although the configuration capacity is immense [1], we will try to summarize the most relevant ones for a first contact with this technology.
Apache Hudi offers the types of partitioning that can be found in other solutions, the main ones will be detailed and the implemented one will be justified:
Apache Hudi has multiple types of indexing [2], we will briefly discuss the most common ones:
Both types of indexes can be used in their global form
In this case, a Bloom Index has been chosen, which is the default in case it is not expressly stated:
"hoodie.index.type" = "BLOOM" The choice of this type of indexing is due to the fact that the use cases that have been raised require a considerably high and efficient data processing.
Apache Hudi offers several types of operations [3] that allow users to manage and modify large data sets. The main operations performed in Stress Tests as well as in other scenarios are detailed below:
In the case of using a MoR table, it is possible to configure the log compaction rate to find the balance between write and read latency that best suits the use case. It is possible to specify a strategy of time or number of delta commits (or both) that execute a compaction process:
compaction.delta_commits
compaction.delta_seconds
compaction.trigger.strategy Certain timeline actions such as compacting, cleaning, archiving and clustering can be performed asynchronously by the application, or even relegated to auxiliary processes to the writing application. In the case of Flink, it can help improve write latency and avoid BackPressure problems in the application:
compaction.async.enabled
hoodie.clean.async
hoodie.archive.async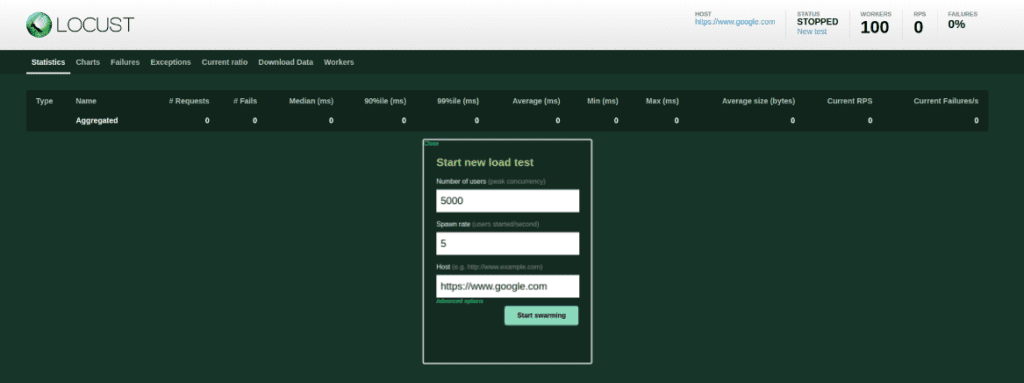
hoodie.clustering.async.enabled When deploying the applications, different tests have been performed, varying both the maximum load of events and the concurrency and exponential degree of growth of the same. This has been possible thanks to the flexibility offered by Locust being built on a Kubernetes cluster, being able to set a maximum limit of concurrency of events and an incremental of them. In the tests, a maximum limit of 5 to 15K simultaneous users (Peak Concurrency) has been established, scaling the frequency of the same in a linear way, from 5 to 20 more users per second (Spawn Rate):
The different tests have been monitored in order to draw conclusions about the performance, taking into account the specific characteristics of each of the formats. The metrics on which the analyses have been based are both the native CloudWatch Metrics (CPU & Memory Utilization, KPUs, LastCheckpoint SIze & Duration,…), as well as the metrics obtained from the Lambdas that periodically consult the number of events available in the buckets and calculate the average latency of the same.
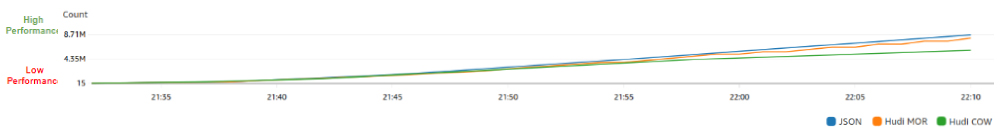
When analyzing the total number of events processed, which are sent gradually, i.e., as time passes more and more events are sent per second, a fairly similar trend is identified although JSON and Hudi MoR stand out over Hudi CoW in terms of performance. It is worth noting that JSON shows a more stable and steady growth compared to Hudi MoR and CoW and this is because the latter are able to handle incremental updates in the data.
The similarity between JSON and Hudi MoR makes the choice entirely based on the characteristics of the project. In case the data is not updated JSON may be a more interesting solution mainly due to its simplicity, while if there is a high frequency of historical data update, Hudi MoR may be a better solution. This is due both to the higher efficiency in reading tasks and because of the possibility to record different versions of the data.
Due to the difficulty of standardizing the latency calculation logic between 3 different types of storage, we have chosen to simplify it by calculating it as the difference between the time of event creation and the time of processing in the respective application.
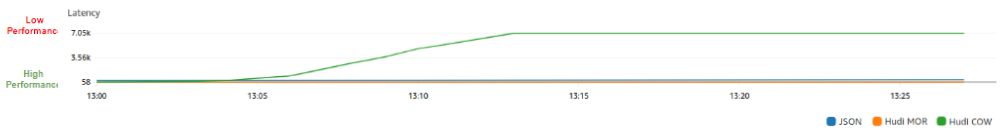
Similar behavior is observed between JSON and Hudi MoR, although the former in a more critical way, having a very low initial latency but as both processing time and load volume increases, this latency is negatively affected.
The choice between JSON and Hudi MoR will depend both on the fault tolerance of the application and the characteristics of each of the formats, in case the data structure is stable and does not change frequently, or does not depend on incremental updates and can deal with complete rewrites, then JSON may be a better choice.
The choice of Hudi CoW over MoR can be made when high error tolerance and high recoverability from failed or corrupted write events are required.
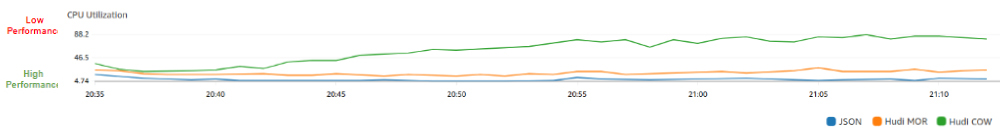
When analyzing CPU usage, a certain homogeneity has been identified among the different tests, even when working with different workloads. JSON and Hudi MoR stand out for having the lowest CPU usage levels, both for different reasons. JSON stands out for its simplicity by directly including the new data without having to deal with data versioning, while MoR does not consume as much CPU since, due to its characteristics, the highest CPU consumption is made when performing read queries, in the write tasks it only identifies the changes that will be applied when querying them.
Remember that CloudWatch native metrics only allow us to monitor the applications, which correspond to the writing tasks. The monitoring of read tasks corresponds to the Lambdas mentioned above.
In this case MoR is more beneficial with respect to CoW, since the higher CPU consumption in MoR occurs when querying the stored data while in CoW it occurs when updating the data.
The choice between the most efficient formats depends on the needs of the project, in case a higher fault tolerance, data versioning and higher reading efficiency are required, MoR will be chosen over JSON, between the two Hudi formats, again, the choice will depend on the characteristics of the project, if the queries require heavy and/or complex transformations, MoR would be chosen; if, on the other hand, the project requires greater data integrity and/or the data ingestion is in batch, CoW would be more interesting because when working with these volumes of data, having backup copies, in case of errors, the impact in terms of costs and recovery time is lower.
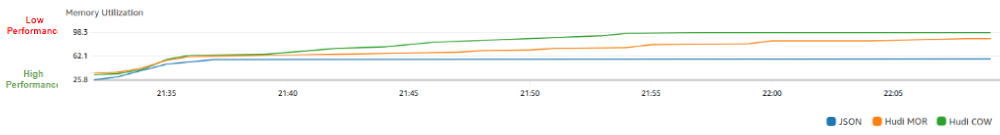
JSON again stands out for having the lowest memory usage values, although for the number of transformations that are performed, they are relatively high, especially considering that it does not have to deal with version management or data merging. These values are due to the fact that it does not have optimized compression capabilities or efficient schema management.
Regarding Hudi, similar conclusions can be drawn as in the CPU usage section, MoR has a higher memory utilization than JSON due to delta log processing and version management and a lower one to CoW since the actual data consolidation does not occur during writing.
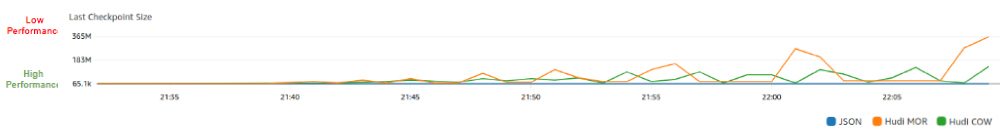
It is important to highlight, once again, the stability of JSON compared to Hudi applications, since it not only shows a lower value than both in the tests performed, but also a stability that is not achieved with either MoR or CoW, since, as can be seen, when monitoring the size of the Checkpoints, considerable volatility is perceived.
Perceived volatility in Hudi applications is mainly due to Checkpoint failures, which leads to a larger Checkpoint volume after the failure. In addition to this, the volatility in Checkpoint sizes may be related to the optimization and compaction operations performed internally that may lead to state compaction, which considerably reduces the size of the Checkpoint.
In order not to exceed the read limit on the Kinesis Stream we have chosen to subscribe the consumers as Enhanced Fan-Out. In some tests in conjunction with Autoscaling this has given problems with the Flink Kinesis connector being unable to close connections when scaling the cluster.
Hudi’s configuration has been another sticking point during development. Under high loads the compaction and cleanup processes are more likely to cause backpressure problems and cause application errors. Although configuring these processes to occur asynchronously can alleviate this problem, conflicts and misalignment between processes can arise under high loads. A balance between these configurations and the application’s cluster capacity are key to the smooth operation of the application.
When analyzing the performance of the 3 applications, there is an additional difficulty due to the nature of the format types, which has an impact both on the architecture and on the development of the logics.
The different behavior of the formats in the ingest complicates the development oflogics when calculating latency. MoR writes to logs after compaction, so the data is not immediately available as is the case with CoW or JSON. This implies that the common measurable metric for all formats is read availability, which is not the main purpose of a MoR table.
One of the great advantages we have found with Hudi is its ability to synchronize with the Glue catalog, creating the tables and keeping them updated without the need for a crawler. This allows for a cleaner application and architecture than in the case of JSON, for which it must be run manually when deploying applications.
The test results show considerable differences between the JSON, Hudi MoR and CoW formats in terms of efficiency, responsiveness and resource utilization. We proceed to analyze each of the aspects in more detail:
Finally, it is interesting to identify in which use cases or projects each of the formats may be more recommendable depending on their characteristics and the network flags that may be established:

AWS Cloud Engineer
I started my career with the development, maintenance and administration of multidimensional databases and Data Lakes. From there I started to be interested in data platforms and cloud architectures, being certified 3 times in AWS and 2 with Hashicorp.
I am currently working as a Cloud Engineer developing Data Lakes and DataWarehouses with AWS for a client related to the organization of sporting events worldwide.
AWS Cloud Engineer
Passionate about data and new technologies, specialized as AWS Cloud Engineer in DataWarehouses optimization and Data Lakes ingestion and transformation processes. Motivated by continuous improvement and automation of service integration.
Actively collaborating with the Cloud Practice group in research and blog development of cutting-edge and innovative technologies such as this one, thus fostering continuous learning.
AWS Cloud Engineer
Dedicated to constantly learning new technologies and their application, enjoying using them to solve technological challenges. I develop my career as a Cloud Engineer designing, implementing and maintaining infrastructure in AWS.
I actively collaborate in the Cloud Practice, where we research and experiment with new technologies, seeking solutions to the challenges faced by our clients.
SOLUCIONES, SOMOS EXPERTOS
Te puede interesar