• Skip to primary navigation
  • Skip to main content
  • Skip to footer
Bluetab

Bluetab

an IBM Company

  • SOLUTIONS
    • DATA STRATEGY
    • Data Readiness
    • Data Products AI
  • Assets
    • TRUEDAT
    • FASTCAPTURE
    • Spark Tune
  • About Us
  • Our Offices
    • Spain
    • Mexico
    • Peru
    • Colombia
  • talent
    • Spain
    • TALENT HUB BARCELONA
    • TALENT HUB BIZKAIA
    • TALENT HUB ALICANTE
    • TALENT HUB MALAGA
  • Blog
  • EN
    • ES

tendencias

¿Existe el Azar?

November 10, 2021 by Bluetab

¿Existe el Azar?

Lorelei Ambriz

Technician

Una breve e informal introducción a la teoría del caos matemático y la teoría de la probabilidad matemática.

Para poder responder a la pregunta sobre la existencia del azar, primero abordaremos otro concepto con el cual posiblemente ya estemos parcialmente familiarizados. Dicho concepto es el caos matemático, o también conocido coloquialmente como el efecto mariposa. Así como algunos conceptos relacionados a este: sistemas dinámicos y determinismo.


¿Qué es el caos matemático?

En resumen, la teoría del caos, o caos matemático (para no perder de vista las matemáticas) tiene como centro de estudio, los sistemas dinámicos que aparentan tener un comportamiento aleatorio, sin embargo estos son gobernados por patrones y determinismo.


¿Qué es un sistema dinámico?

Un sistema dinámico es un conjunto de fenómenos deterministas que interactúan uno con otro dentro de este conjunto en función de una colección de parámetros (usualmente el parámetro más usado es el tiempo).

Un ejemplo sencillo de sistema dinámico es un péndulo simple. Para detallar un poco más, mencionemos los componentes de este sistema. Un péndulo simple consiste en un tubo/varilla que en uno de los extremos sostiene un peso mientras que del otro, estará sostenido de forma que pueda columpiarse. Los componentes de este sistema son: la longitud de la varilla, el peso que carga, la fuerza gravitatoria y la altura inicial a la que hará su primera oscilación. El resultado de la ejecución de este sistema es una medición del tiempo.

Un ejemplo mucho más sofisticado es el planeta Tierra. Entre sus componentes más notorios están: árboles, agua, aire, radiación recibida por el sol, la geografía del planeta, etc. Uno de los resultados apreciables en este sistema como resultado de estos componentes es el clima de la Tierra.


¿Qué es el determinismo?

Decimos que un modelo es determinista cuando existe una ley o regla que siempre va a cumplir dicho modelo asociado a un fenómeno particular. O en otras palabras, está determinado por dichas leyes y las condiciones que le rodean. Por dar un ejemplo, como si se tratase de la descripción de la maquinaria en un reloj con péndulo. En esta maquinaria hay todo un sistema dinámico que cambia con respecto al tiempo. Poseé un conjunto de engranajes, manecillas y un péndulo, que organizados de forma específica, nos dará como resultado un dispositivo con el que medir el tiempo a lo largo de un día.

Para comprender y/o descubrir las leyes o reglas que gobiernan estos sistemas, los matemáticos, en resumen, recurrimos a la búsqueda de patrones con un razonamiento lógico deductivo así como algunas veces es necesaria la experimentación e incluso el método científico.


Y ahora, ¿Qué sigue?

Habiendo hablado un poco sobre sistemas dinámicos, determinismo y caos matemático introduciremos el siguiente concepto: estabilidad de sistemas dinámicos. ¿Cómo podemos considerar la estabilidad?. Sin entrar en el rigor matemático pero con algo de matemáticas, un sistema es estable cuando tenemos una curva ‘f’ definida por una condición inicial ‘x0’ en este sistema y trazamos una “tubería” alrededor de esta curva para que quede contenida en esta (vecindad de convergencia). Y entonces para cualquier condición inicial ‘t0’ cercana a ‘x0’, que nos define una curva ‘g’ ocurrirá uno de los siguientes casos:

  • Si g → f (tiende o cada vez se acerca más a f) entonces el sistema es asintóticamente estable.
  • Si g permanece dentro de la tubería en todo momento, entonces el sistema es estable.
  • Si a partir de un momento, g sale de la tubería y de cualquier tubería con centro en f, entonces el sistema es inestable.


Observación
: si ‘g’ saliera 1 vez (o incluso n veces), entonces hacemos una tubería con centro en f que contenga a toda la curva g. Por eso se dice que sale de todas las tuberías posibles, porque entonces ‘g’ se vuelve completamente diferente a ‘f’ a partir de algún momento.

Ahora usando ejemplos con pares idénticos de péndulos para tener una mayor visibilidad de los casos anteriores:

  • Levanta el par de péndulos, y al soltarlos de forma simultánea, estos oscilarán con la misma frecuencia y se detendrán casi al mismo tiempo. Esto es estabilidad asintótica.
  • Levanta el par de péndulos, pero instalados sobre una “máquina de movimiento perpetuo”. Al soltarlos estos oscilarán con la misma frecuencia hasta que se detenga la máquina.
  • Ahora considera un par de péndulos dobles, y levanta dicho par a una misma posición. Al soltar los péndulos, después de unos segundos cada péndulo tendrá su trayectoria completamente diferente al otro. Esto es inestabilidad. De hecho, en este caso en particular, las trayectorias parecieran ser aleatorias. Sin embargo siguen cumpliendo las leyes que rigen a los péndulos.

Cabe recordar que aunque creamos ponemos a la misma altura los péndulos, en el mundo físico hay una diferencia mínima entre estas alturas. Para los sistemas estables, la estabilidad parece menospreciar dicha diferencia. En cambio, el sistema inestable es altamente sensible a estos cambios y esta pequeña diferencia inicial termina siendo una enorme diferencia al poco tiempo.


¿Dónde más podemos ver el caos matemático?

La respuesta es relativamente fácil: en casi todos los lugares a donde miremos. Desde las trayectorias y posición donde caen las hojas de un árbol al desprenderse de sus ramas, las acciones de las acciones en la bolsa, hasta incluso los procesos biológicos de los seres vivos y sin olvidar un ejemplo muy importante: el clima de la Tierra. Una persona podría reflexionar que todo el universo está gobernado por caos matemático, determinismo absoluto. Simplemente las relaciones que ocurren entre los componentes del universo pueden ser desde relativamente simples, a altamente complejas.


Ahora con todo lo planteado: ¿Existe el azar?

La respuesta pareciera ser que no. Sin embargo, notemos un detalle importante sobre lo que conocemos del azar: podemos tener la seguridad que un resultado o salida obtenido de un evento aleatorio es desconocido, ya que si lo supiéramos de antemano, entonces el evento no sería aleatorio. En este punto pareciera que podemos ver el caos matemático como azar, sin embargo este es determinista y eso nos implica que conociendo todos los componentes que definen esta curva (leyes, condiciones iniciales e interacciones entre todas las variables), podemos conocer de antemano todas las salidas. Pero aquí está precisamente el detalle: conocer todas las interacciones de forma precisa entre todas las variables. Cuando estas interacciones se vuelven muy complejas dentro del sistema y este se vuelve inestable, en lugar de intentar comprender lo que ocurre entre estas variables, podemos empezar a analizar las posibles salidas o resultados de este. De este análisis podemos ver que otros patrones empiezan a emerger: distribuciones de probabilidad.


Distribuciones de probabilidad: un vistazo a la teoría de la probabilidad.

La teoría de la probabilidad es una rama dentro de las matemáticas que estudia los eventos aleatorios y estocásticos. Si bien la teoría clásica de la probabilidad se reduce a hacer conteos de casos favorables y compararlos contra todos los posibles escenarios, cuando se propone un conjunto de axiomas basados en la teoría de conjuntos y la teoría de la medida por parte de Andréi Kolmogórov es que la teoría de la probabilidad adquiere rigor matemático y así se puede extender su estudio más allá de los marcos clásicos de esta. Argumentos en el contexto de la probabilidad utilizados en diversas áreas como la física, economía, biología entre otras cobran fuerza gracias a esta aportación. A partir de aquí es que surge la teoría moderna de la probabilidad. Algunos de los conceptos y resultados más importantes de esta teoría moderna son:

  • Variables aleatorias y funciones de distribución.
  • Leyes de los grandes números.
  • Teorema del límite central.
  • Procesos estocásticos.


Conexión entre los sistemas caóticos y la probabilidad.

Como platicamos anteriormente, estudiando las salidas o resultados de sistemas dinámicos inestables podemos ver que hay patrones que emergen de estos. Curiosamente estos se comportan como variables aleatorias y funciones de distribución de la teoría de la probabilidad. Esto se debe a algunos resultados importantes como son las leyes de los grandes números y el teorema del límite central entre otros. Recordando que la teoría de la probabilidad adquiere su rigurosidad a partir de los axiomas de Kolmogorov que tienen origen en la teoría de conjuntos y la teoría de la medida.


Entonces: ¿el azar existe?

Si bien podemos concluir que el universo es gobernado por leyes de las cuales algunas conocemos y otras no (de aquí podemos abrir otro tema para otra ocasión: Lo que sabemos, lo que no sabemos, y lo que no sabemos que no sabemos), y esto tiene implícito la omnipresencia del determinismo. Podemos concluir que el azar no tiene lugar en el universo. Sin embargo, recordemos que la teoría de la probabilidad es una construcción humana, cuya rigurosidad y patrones pueden ser conectados con otras áreas, y como ya vimos, particularmente pueden ser conectados con el caos matemático para cambiar el enfoque de estudio de los fenómenos regidos por el caos. Pasando de conocer las leyes que los gobiernan para entender las salidas y resultados de estos, a conectar dichos patrones con las distribuciones de probabilidad que tienen toda una teoría matemática que las respalda, así como un área que las explota como es la estadística.


Explotando el azar

Sabiendo que el azar está directamente conectado con el desconocimiento de resultados y ocurrencias. Y precisamente por esta razón es que podemos explotar la teoría de la probabilidad, entonces podemos pasar a construir un objeto muy importante dentro de la ciencia de la computación: los generadores de números aleatorios.

Estos generadores son objetos muy útiles para dotar de nuestros procesos con la esencia del caos y así traer la complejidad del mundo a nuestros análisis, modelos, simulaciones y demás. Sin embargo, cabe mencionar que para obtener generadores de números aleatorios que en verdad tengan lo que buscamos, es importante notar que no debe haber un patrón sencillo en estos. ¿Entonces cómo podemos recurrir a construir un buen generador de números aleatorios?. La respuesta se encuentra en el mismo caos. Por ejemplo, usar las curvas que recorren los péndulos dobles, o la paridad en los dígitos decimales de π, entre otros.

Simulando el azar en nuestros procesos, podemos aprovechar una de las características más importantes de este, la cual es: la imparcialidad. Con esta, eliminamos sesgos de nuestras muestras (característica fundamental para entrenar con imparcialidad a nuestros modelos de aprendizaje máquina), contribuyendo incluso al mismo entrenamiento que ocurre en los modelos de aprendizaje máquina y aprendizaje profundo por medio de la optimización de las funciones de costo. Otra simulación muy importante a mencionar es la simulación de MonteCarlo, la cuál nos permite obtener muestras aleatorias que representan lo que podemos modelar, así como pueden ser usadas para diferentes cálculos computacionales pesados que de forma clásica podrían ser desde muy complejos, hasta imposibles.


Conclusión

El azar es un constructo humano que si bien no existe en el universo de forma natural debido a la naturaleza compleja de este, como concepto humano nos ayuda a comprender y estudiar lo que sucede reduciendo la complejidad que surge de forma natural. Así que en efecto, el azar existe, porque la humanidad lo construyó y un día se dió cuenta que le ayudaba a comprender mejor el complejo universo en el que vivimos.

¿Quieres saber más de lo que ofrecemos y ver otros casos de éxito?
DESCUBRE BLUETAB

SOLUCIONES, SOMOS EXPERTOS

DATA STRATEGY
DATA FABRIC
AUGMENTED ANALYTICS

Te puede interesar

Bank Fraud detection with automatic learning

September 17, 2020
LEER MÁS

Basic AWS Glue concepts

July 22, 2020
LEER MÁS

Mi experiencia en el mundo de Big Data – Parte II

February 4, 2022
LEER MÁS

We have a Plan B

September 17, 2020
LEER MÁS

IBM to acquire Bluetab

July 9, 2021
LEER MÁS

Container vulnerability scanning with Trivy

March 22, 2024
LEER MÁS

Filed Under: Blog, tendencias

Big Data and loT

February 10, 2021 by Bluetab

Big Data and IoT

Bluetab Utilities & Energy

MODEL FOR ASSOCIATION OF METER SUPPLY IN NETWORKS

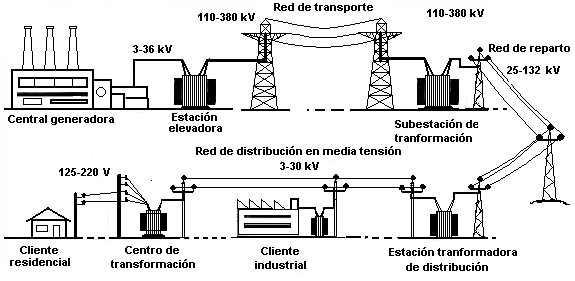
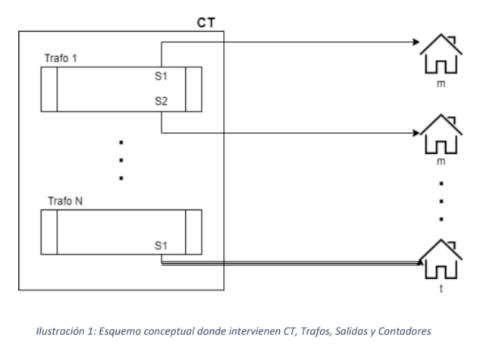
As part of its dynamic energy demand management strategy, our client, a leading energy company in Spain and with international business, needed to associate the meters spread around the network in customer facilities with the various transformers in the transformer substations and with their various low voltage outputs, either single-phase or three-phase, on the same transformer.
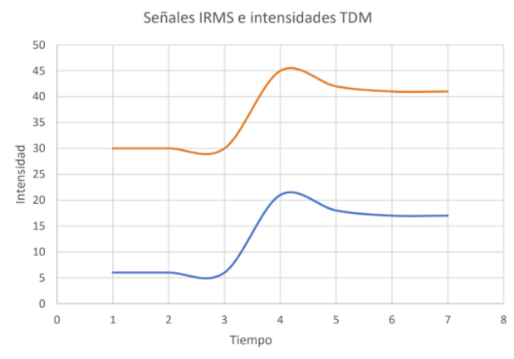
The algorithm developed was migrated in collaboration with one of Madrid’s most prestigious universities. The aim of this algorithm is to associate, in a probabilistic manner, given a customer meter, its output and phase in the transformer substation to which it is connected. In other words, to identify the low voltage phase and output that supplies each of the meters in the low voltage transformer substations with advanced supervision. All this is achieved by means of a measure of dependence used in the field of statistics and probability theory called correlation distance or distance covariance.
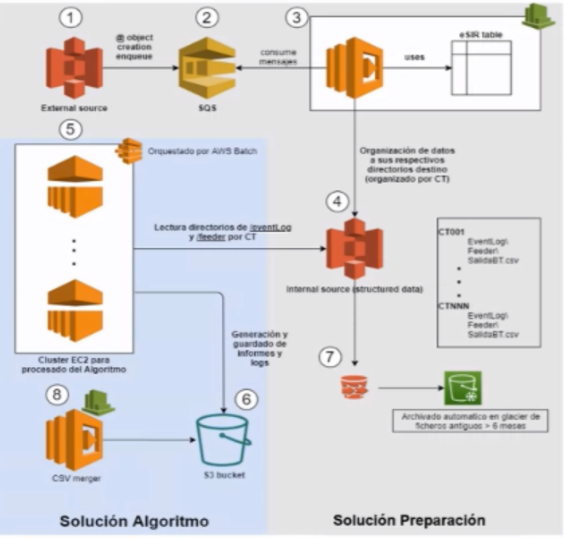
This productivity improvement project was implemented on an AWS architecture. The appropriate processing of the large amount of information produced, the understanding of the monitoring and supervision of network transformers and the detection of incremental voltage changes, and the measurement of consumption in the meters transferred by the PLC network were critical to proper implementation.


Supply records x 6 months historical logs = +720M

Records in transformers x 6 months historical logs = +214MM

Do you want to know more about what we offer and to see other success stories?
DISCOVER BLUETAB

SOLUTIONS, WE ARE EXPERTS

DATA STRATEGY
DATA FABRIC
AUGMENTED ANALYTICS

You may be interested in

Leadership changes at Bluetab EMEA

April 3, 2024
READ MORE

Data Mesh

July 27, 2022
READ MORE

$ docker run 2021

February 2, 2021
READ MORE

Incentives and Business Development in Telecommunications

October 9, 2020
READ MORE

¿Existe el Azar?

November 10, 2021
READ MORE

LakeHouse Streaming on AWS with Apache Flink and Hudi (Part 2)

October 4, 2023
READ MORE

Filed Under: Blog, tendencias

$ docker run 2021

February 2, 2021 by Bluetab

$ docker run 2021

David Quintanar Pérez

Consultor BI

I first came across Docker when I was at university, in my first Distributed Database class. It was something odd at first, something I could not imagine would exist, love of development at first sight.

Problems that arise when developing

When I thought about learning, experimenting or building software, I did it on my machine. I had to install everything I needed in it to start developing and I had to fight with the versions, dependencies, among others, and that takes time. Then I faced the challenge of sharing what I had created with friends, a team or a lecturer. Not to mention that they had to install everything too, and with the same specifications. The best option was to do it in a virtual machine from the start and to be able to share it with everything configured. Then finally you faced the fact of the size it occupied. Hoping by this time that it did not have to simulate a cluster. In the final battle are you, the application and the virtual machine(s) against the resources of the computer where it runs in the end. And even overcoming the problems we had already met, the dependencies, the OS and the hardware resources challenged us again.

Docker as a solution

On that day in class, I discovered the tool that lets you Build, Distribute and Run your code wherever, in an easy, open source manner.
This means that with Docker, at build time, you can specify the OS where it will run, the dependencies and versions of the applications it will occupy. Ensuring that it will always run in the environment it requires.

That when distributing what you built, to who needs it, you will be able to do it quickly, simply and without worrying about pre-installing, because everything will be defined from the time when you started building.

When you specify the environment you need, you can replicate it in development, production or on whatever computer you want without extra effort. Ensuring that as long as you have Docker, it will run properly

«Docker was created in 2013, but if you still don’t know it, 2021 will be the year you start using it. StackOverflow now has it rated second among the platforms that developers love most and in first place as the one they want most.»

What is Docker? And how does it work?

Containers

Let’s take a closer look at what Docker is and how it works. If you have already had an initial encounter with this tool, you will have read or heard about the containers.

Starting with the fact that containers are not unique to Docker. There are Linux containers, which allow applications to be packaged and isolated to enable them to run in different environments. Docker was developed from LXN, but has deviated from it over time.

Images

And Docker takes it to the next level, making it easy to create and design containers with the aid of images.

Images can be seen as templates that contain a set of instructions in order, which are used to create a container and how this needs to be done.

Docker Hub

Docker Hub is now the world’s largest library and community for container images, where you can find images, obtain them, share what you create and manage them. You just need to create an account. Do not hesitate to go and explore it when you finish reading.

Example

Now imagine you are developing a web application, you need an Apache HTTP service in its version 2.5 and a MongoDB service in its latest version.

You could set up a container for each service or application with the help of predefined images you got from Docker Hub and they can communicate with each other with the aid of Docker networks.

Using MongoDB, but with its stored database information coming from your preferred provider’s cloud service. This can be replicated in the development and production environment in the same way, quickly and easily.

Containers versus Virtual Machines

One difference is that containers make the operating system virtual instead of hardware.

If we look at other aspects, as well as multiple virtual machines can run in a single one, containers can do the same, but containers take less time to start up.

And while each virtual machine includes a complete copy of an operating system, applications, etc., containers can share the same OS kernel, which can make them lighter. Container images are typically tens of MB in size, while virtual machines can take up tens of GB.

There are more things that I invite you to look out for, because this does not mean we stop using virtual machines or that Docker is better, just that we have another option.

Having containers running within virtual machines has become more complex and flexible

Download and install Docker

You can download and install Docker on multiple platforms (MAC, Windows and Linux) and you can consult the manual from the official website.

There are also several cloud service providers that let you use it.

Play with Docker

You also have the alternative of trying out Docker without installation with Play with Docker. As the name says, you can play with Docker by downloading images or repositories to run containers in Play with Docker instances. All at your fingertips with a Docker Hub account.

2021

Now you know more about the issues that exist in development, what Docker is and that it works as a solution, a little about its system of containers and images that you can create or get from Docker Hub. You understand some differences between Virtual Machines and Docker. That docker is multi-platform and you can experiment with it without installing it on your computer with Play with Docker.

Today more and more job offers are requesting Docker, including as a value added to the requirements needed to fill a job post. Remember that if you are in the world of software development, if you want to build, distribute and run code wherever, easily, solve your problems, experiment in new technologies, learn and understand the idea of the title in this article… You need to learn Docker.

Do you want to know more about what we offer and to see other success stories?
DISCOVER BLUETAB

SOLUTIONS, WE ARE EXPERTS

DATA STRATEGY
DATA FABRIC
AUGMENTED ANALYTICS

You may be interested in

LakeHouse Streaming on AWS with Apache Flink and Hudi (Part 1)

April 11, 2023
READ MORE

El futuro del Cloud y GenIA en el Next ’23

September 19, 2023
READ MORE

Hashicorp Boundary

December 3, 2020
READ MORE

Bank Fraud detection with automatic learning II

September 17, 2020
READ MORE

Using Large Language Models on Private Information

March 11, 2024
READ MORE

MDM as a Competitive Advantage in Organizations

June 18, 2024
READ MORE

Filed Under: Blog, tendencias

Incentives and Business Development in Telecommunications

October 9, 2020 by Bluetab

Incentives and Business Development in Telecommunications

Bluetab

The telecommunications industry is changing faster than ever. The growing proliferation of competitors forces operators to consider new ways of being relevant to customers and businesses. Many companies have decided to become digital service providers, with the aim of meeting the needs of increasingly demanding consumers.

Telecommunications companies have endured a decade of continual challenges, with the industry subjected to a series of disruptions that push them to innovate to avoid being left behind. The smartphone revolution has led consumers to demand unlimited data and connectivity over other services.

Some studies show that the main challenges facing telecoms operators are growing, disruptive competition, agility, and investment, from which four key messages are drawn for understanding the future of the sector:

1. Disruptive competition tops the list of sector challenges

Platforms like WhatsApp-Facebook, Google and Amazon have redefined the customer experience by providing instant messaging services, which have had a direct impact on demand for services such SMS, drastically decreasing it.

Additionally, the market trend is to offer multi-service packages and to enable the customer to customise them according to their own needs, leading to mergers, acquisitions and partnerships between companies, in order to offer ever more diverse services.

2. Commitment to digital business models and innovation in the customer experience

The great opportunities offered by digitisation have made it the concept that the vast majority of companies in the sector aspire to. It is not surprising that in the telecommunications sector too, attempts are being made to move towards a digital business model.

According to the Vodafone Enterprise Observatory, 53% of companies understand digitisation as the use of new technologies in their business processes and 45% as the use of new technologies to improve customer service.

3. The post-2020 landscape will be transformed by 5G

The new generation of mobile telephony, 5G, that will revolutionise not only the world of communications but the industry of the future, has just reached Spain. The four domestic operators – Telefónica, Orange, Vodafone and MásMóvil – have already launched the first commercial 5G services, although only in major cities, with reduced coverage and greatly limited technical capabilities. This early start has also been influenced by the change that has occurred due to the COVID-19 pandemic, which has revealed the need for good quality connection at all times for smart working, digital education, on-line shopping and the explosion of streaming. Spain has Europe’s most powerful fibre network, but there are still regions without coverage. Thanks to full commitment to FTTH (fibre-to-the-home), Spain has a stable connection that runs from the telephone exchange to home directly. According to data from the Fibre to the Home Council Europe 2020, Spain has more fibre-connected facilities (10,261) than France, Germany, Italy and the United Kingdom put together.

The operators play a leading role with these needs for digitisation.

Measures to be taken into account

Achieving such long-awaited digitisation is not an easy process, and it requires a change in organisational mentality, structure and interaction.

While talent is believed to be a key element for digital transformation, and a lack of digital skills is perceived to be a barrier to that transformation, actions say otherwise. Because only 6% of managers consider growth and retention of talent to be a strategic priority.

Workers’ perspective on their level of work motivation:

  • 40% feel undervalued and unappreciated by their company. This increases the likelihood that employees will look for another job that will give them back their motivation to work.
  • 77% of workers acknowledge that they would get more involved in their work if their achievements were recognised within the organisation.
  • Over 60% of people state that an incentives or social benefits programme contributes to them not wanting to look for another job. This is something for companies to take into account, because it is estimated that retaining talent can generate increases in company profits of between 25% and 85%.

Companies’ perspective on their employees’ level of work motivation:

  • 56% of managers of people say they are “concerned” about their employees leaving the company.
  • 89% of companies believe that the main reason their workers look for another job is to go for higher wages. However, only 12% of employees who change company earn more in their new jobs, demonstrating that it is not economic remuneration alone that motivates the change.
  • 86% of companies already have incentives or recognition systems for their employees.

So, beyond the changes and trends set to occur in this sector, Telecommunications companies need to intensify their talent retention and make it a priority to address all the challenges they face on their journey to digitisation.

A very important measure for retaining and attracting talent is work incentives. Work incentives are compensations to the employee from the company for achieving certain objectives. This increases worker engagement, motivation, productivity and professional satisfaction.

As a result, companies in the sector are increasingly choosing to develop a work incentives programme, where they have previously studied and planned the appropriate and most suitable incentives, depending on the company and the type of employees, with the aim of motivating their workers to increase their production and improve their work results.

In the case of the communications sector, these measures will also increase company sales and profits. Within this sector, sales are made through distributors, agencies, internal sales and own stores, aimed both at individual customers and companies. That is why such importance is given to the sales force, leading to more highly motivated sales people with greater desire to give the best of themselves every day, so leading to improved company profits.

Furthermore, all the areas associated with sales, departments that enable, facilitate and ensure the healthiness of sales, as well as customer service, will be subject to incentives.

For an incentive system to be effective, it is essential for it to be well-defined, well-communicated, understandable and based on measurable, quantifiable, explicit and achievable objectives.

Work incentives may or may not be economic. For the employee, it needs to be something that recompenses or rewards them for their efforts. Only in that way will the incentives plan be effective.

Finally, once the incentives plan has been established, the company needs to assess it regularly, because in a changing environment such as the present, company objectives, employee motivations and the market will vary. To adapt to changes in the market and to the various internal and external circumstances, it will need to evolve over time.

What advantages do incentive systems offer telecoms companies?

Implementing an incentives plan in the company has numerous benefits for workers, but also for companies it:

  • Improves employee productivity
  • Attracts qualified professionals
  • Increases employee motivation
  • Assesses results
  • Encourages teamwork


In one of our telecoms clients, /bluetab
 has developed an internal business tool to calculate incentives for the various areas associated with sales. The work incentives are economic in this case, and performance assessment, associated with meeting their objectives, consists of an economic percentage of their salary. Achieving a series of objectives measures contribution to profitable company growth over a period of time.

The following factors are taken into account in developing the incentives calculation:

  • Policy: Definition and approval of the incentives policy for the various sales segments and channels by HR.
  • Objectives: Distribution of company objectives as spread across the various areas associated with sales.
  • Performance: Performance of the sales force and areas associated with sales over the periods defined previously in the policy.
  • Calculation: Calculation of performance and achievement of objectives, of all the profiles included in the incentive policy.
  • Payment: Addition of payment to the payroll for the corresponding performance-based incentives. Payments will be bimonthly, quarterly, semi-annual or annual.

How do we do it?

/bluetab develops tools for tracking the achievement of objectives and calculation of incentives. This allows everyone related to sales, to whom this model applies, to track their results, as well as the various departments related to their decision, human resources, sales managers, etc.

The most important thing in developing these types of tools is to analyse all the client’s needs, gather all the information necessary for calculating the incentives and fully understand the policy. We analyse and compile all the data sources needed for subsequent integration into a single repository.

The various data sources may be Excel, csv or txt files, the customer’s various information systems, such as Salesforce, offer configuration tools, database systems (Teradata, ORACLE, etc.). The important thing is to adapt to any environment in which the client works.

We typically use processes programmed in Python to extract from all the data sources automatically. We then integrate all the resulting files using ETL processes, performing all the necessary transformations and loading the transformed data into a database system as a single repository (e.g. Teradata).

Finally, we connect the database to a data visualisation tool, such as Power BI. All the incentives calculations are implemented in that tool. Scorecards are then published to share this with the various users, providing security both at access and data protection levels.

As an added value, we include forecasts in two different ways. The first is based on data provided by the customer, reported in turn by the sales force. The second by integrating predictive analysis algorithms using Python, Anaconda, Spider, R which, based on a historical record of the various KPIs, enables estimation of future data with low margins of error. This allows for prediction of the results of future incentives.

Additionally, simulations of the various scenarios can be carried out, using parameters, for calculation of the objectives and achievement of incentives.

The/bluetab tool developed will enable departments affected by incentives to perform daily, weekly, monthly or yearly monitoring of their results in a flexible, dynamic, agile manner. As well as allowing the departments involved in the decisions to monitor the data, it will also enable them to improve future decision making.

Benefits provided by /bluetab

  • Centralisation of information, the chance to perform calculation and monitoring using a single tool.
  • Higher updating frequency: going from monthly and semi-annual updating in some cases to daily, weekly and real-time on occasions.
  • Reduction of 63% in time spent on manual calculation tasks.
  • Greater traceability and transparency.
  • Scalability and depersonalisation of reporting.
  • Errors from manual handling of multiple different sources reduced by 11%. Data quality.
  • Artificial intelligence simulating different scenarios.
  • Dynamic visualisation and monitoring of information.
  • Improved decision-making at the business level.
Do you want to know more about what we offer and to see other success stories?
DISCOVER BLUETAB

SOLUTIONS, WE ARE EXPERTS

DATA STRATEGY
DATA FABRIC
AUGMENTED ANALYTICS

You may be interested in

5 common errors in Redshift

December 15, 2020
READ MORE

Databricks on AWS – An Architectural Perspective (part 2)

March 5, 2024
READ MORE

Snowflake Advanced Storage Guide

October 3, 2022
READ MORE

Workshop Ingeniería del caos sobre Kubernetes con Litmus

July 7, 2021
READ MORE

CDKTF: Otro paso en el viaje del DevOps, introducción y beneficios.

May 9, 2023
READ MORE

Databricks on AWS – An Architectural Perspective (part 1)

March 5, 2024
READ MORE

Filed Under: Blog, tendencias

How much is your customer worth?

October 1, 2020 by Bluetab

How much is your customer worth?

Bluetab

Our client is a multinational leader in the energy sector with investments in extraction, generation and distribution, with a significant presence in Europe and Latin America. It is currently developing business intelligence initiatives, exploiting its data with embedded solutions on cloud platforms. 

The problem it had was big because, to generate any use case, it needed to consult countless sources of information generated manually by various departments, including text files and spreadsheets, but not just that, it also had to use information systems ranging from Oracle DB to Salesforce. 

«The problem it had was big because, to generate any use case, it needed to consult countless sources of information generated manually»

The solution was clear; all the necessary information needed to be concentrated in a single, secure, continually available, organised and, above all, cost-efficient place. The decision was to implement a Data Lake in the AWS Cloud.

In project evolution, the client was concerned about the vulnerabilities of its local servers, where they have had some problems with service availability and even the a computer virus intrusion, for which /bluetab proposes to migrate the most critical processes completely to the cloud. These include a customer segmentation model, developed in R. 

Segmenting the customer portfolio requires an ETL developed in Python using Amazon Redshift as DWH, where a Big Data EMR cluster is also run on demand with tasks developed in Scala to handle large volumes of transaction information generated on a daily basis. The process results that were previously hosted and exploited from a MicroStrategy server now were developed in reports and dashboards using Power BI.

«…the new architecture design and better management of cloud services in their daily use enabled us to optimise cloud billing, reducing OPEX by over 50%»

Not only did we manage to integrate a significant quantity of business information into a centralised, governed repository, but the new architecture design and better management of cloud services in their daily use enabled us to optimise cloud billing, reducing OPEX by over 50%. Additionally, this new model enables accelerated development of any initiative requiring use of this data, thereby reducing project cost.

Now our customer wants to test and leverage the tools we put into their hands to answer a more complex question: how much are my customers worth?

Its traditional segmentation model in the distribution business was based primarily on an analysis of payment history and turnover. In this way they predict the possibility of defaults in new services, and the potential value of the customer in billing terms. All of this, crossed with financial statement information, still formed a model with ample room for improvement.

«At /bluetab we have experience in development of analytical models that ensure efficient and measurable application of the most suitable algorithms for each problem and each data set»

At /bluetab we have experience in development of analytical models that ensure efficient and measurable application of the most suitable algorithms for each problem and each data set, but the market now provides solutions as very mature analytical models that, with minimum parametrisation, enable good results while drastically reducing development time. As such, we used a well-proven CLV (Customer Lifetime Value) model to help our client evaluate the potential life-cycle value of its customers.

We have incorporated variables in the new scenario such as After-sales service costs (such as recovery management, CC incident resolution costs, intermediary billing agent costs, etc.), and Provisioning logistics costs into the customers’ income and expense data, making it possible to include data on geographical positioning for distribution costs, market maturity in terms of market share, or crossing with information provided by different market sources. This means our client can make better estimates of the value of its current and potential customers, and perform modelling and forecasting of profitability for new markets or new services.

The potential benefit from application of the analytical models depends on less “sexy” aspects, such as consistent organisation and governance of the data in the back office, the quality of the data provisioning the model, implementation of the model following DevOps best practices and constant communication with the client to ensure business alignment and to be able to extract/visualise conclusions of value from the information obtained. And at /bluetab we believe this is only possible with expert technical knowledge and a deep commitment to understanding our clients’ businesses.

«The potential benefit from application of the analytical models is only possible with expert technical knowledge and a deep commitment to understanding our clients’ businesses»

Do you want to know more about what we offer and to see other success stories?
DISCOVER BLUETAB

SOLUTIONS, WE ARE EXPERTS

DATA STRATEGY
DATA FABRIC
AUGMENTED ANALYTICS

You may be interested in

CLOUD SERVICE DELIVERY MODELS

June 27, 2022
READ MORE

Cómo preparar la certificación AWS Data Analytics – Specialty

November 17, 2021
READ MORE

Mi experiencia en el mundo de Big Data – Parte I

October 14, 2021
READ MORE

Snowflake, el Time Travel sin DeLorean para unos datos Fail-Safe.

February 23, 2023
READ MORE

Desplegando una plataforma CI/CD escalable con Jenkins y Kubernetes

September 22, 2021
READ MORE

MICROSOFT FABRIC: Una nueva solución de análisis de datos, todo en uno

October 16, 2023
READ MORE

Filed Under: Blog, tendencias

Bank Fraud detection with automatic learning II

September 17, 2020 by Bluetab

Bank Fraud detection with automatic learning II

Bluetab

A model to catch them all!

The creation of descriptive and predictive models is based on statistics and recognising patterns in groups with similar characteristics. We have created a methodology that enables detection of anomalies using historical ATM channel transaction behaviour for one of the most important financial institutions in Latin America.

Together with the client and a group of statisticians and technology experts, we created a tool for audit processes that facilitates the detection of anomalies in the fronts that is most important and open to action for the business. From operational issues, availability issues and technology errors to internal or external fraud.

The ATM channel represents an area of business that is subject to direct contact with the public who use it, and is vulnerable for reasons such as connectivity and hardware faults. The number of daily transactions in a network of over 2,000 ATMs involves a huge number of indicators and metrics of technological and operational natures. Currently, a group of auditors is given the task of manually sampling and analysing this data stream to identify risks in the operation of the ATM channel.

The operational characteristics mean that the task of recognising patterns is different for each ATM, as the technology in each unit and the volume of transactions is influenced by factors such as the seasonal phenomenon, demography and even the economic status of the area. To tackle this challenge, /bluetab developed a framework around Python and SQL for segmentation of the most appropriate typologies according to variable criteria, and the detection of anomalies across a set of over 40 key indicators for channel operation. This involved unsupervised learning models and time series that enable us to differentiate between groups of comparable cash machines and achieve more accurate anomaly detection.

The purely mathematical results of this framework were condensed and translated into business-manageable vulnerability metrics, which we developed together with the end user in Qliksense. In this way, we handed the client an analysis environment that covers all the significant operational aspects, but which also enables incorporation of other scenarios on demand.

Now the auditors can analyse months of information considering the temporary market situation, geographic location or technological and transactional characteristics, where they previously only had the capacity to analyse samples.

We are working with our client to drive initiatives to incorporate technology and make the operation more efficient and speed up the response time in case of any incidents.

Do you want to know more about what we offer and to see other success stories?
DISCOVER BLUETAB

SOLUTIONS, WE ARE EXPERTS

DATA STRATEGY
DATA FABRIC
AUGMENTED ANALYTICS

You may be interested in

Spying on your Kubernetes with Kubewatch

September 14, 2020
READ MORE

Oscar Hernández, new CEO of Bluetab LATAM.

May 16, 2024
READ MORE

Cómo depurar una Lambda de AWS en local

October 8, 2020
READ MORE

De documentos en papel a datos digitales con Fastcapture y Generative AI

June 7, 2023
READ MORE

Data Governance: trend or need?

October 13, 2022
READ MORE

Boost Your Business with GenAI and GCP: Simple and for Everyone

March 27, 2024
READ MORE

Filed Under: Blog, tendencias

  • Page 1
  • Page 2
  • Go to Next Page »

Footer

LegalPrivacy Cookies policy

Patron

Sponsor

© 2025 Bluetab Solutions Group, SL. All rights reserved.